This article prepared by Ron Bishop and published by TTI Market Eye summarizes trends in 2000-2024 connector market.
This is a very difficult environment in which to forecast. A good example is the recent forecast of the U.S. Federal Reserve. First, the Fed announced that inflation was declining and there would probably be three rate cuts in 2024.
Just weeks later it was announced that inflation was not declining but increasing and there may be no rate cuts in 2024. This is not a stellar forecasting performance, especially considering their enormous budget, large staff of highly educated economists and access to volumes of economic statistics. But that is the uncertain environment in which we live.
Also consider all the turmoil in the world that could drastically influence economic conditions:
- Russia and Ukraine
- Iran, Israel, Hamas and Gaza
- Tension between China and Taiwan
- Continued friction between North and South Korea
- Threat of superpower tensions between the U.S. and China/Russia
Any of the above situations could trigger a black swan event and create negative business conditions.
So, it is into these shark infested waters that Bishop & Associates forecasts the connector industry.
The Past 23 Years
The following chart presents the annual change in sales for the connector industry since the beginning of the 21st century.
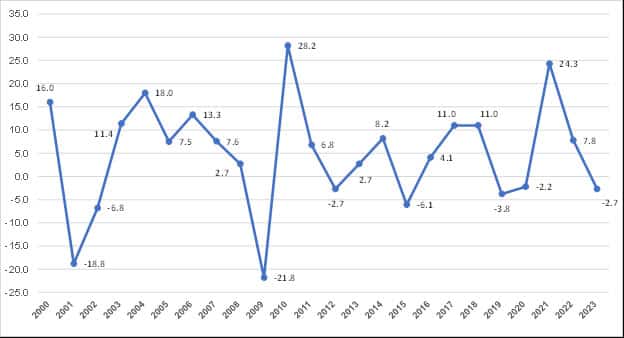
There are some interesting findings in this chart that provide a framework for forecasting connector demand.
Since 2000, there have been eight down years and 15 growth years. So, industry sales declined approximately one-third of the time.
The peaks and valleys were caused by unusual events:
- 2000 sales were up 16.0% and caused by the rapid growth of the Internet.
- 2001 and 2002 were down 18.8% and 6.8% respectively as the dot-com bubble burst.
- 2004 was up 18.0% fueled by the rapid growth of China.
- 2009 was down 21.8% caused by the financial housing crisis.
- 2021 was up 24.3% because of pent-up demand after COVID-19.
Through all the peaks and valleys of the 21st century, the industry still managed a compound annual growth rate (CAGR) of 3.7%. As the following table demonstrates, industry growth was fueled by China’s growing economy.
The Past Five Years
During the period 2018 through 2023, the world experienced the COVID 19 pandemic and the recovery. During this same period, the industry experienced three sales declines and two growth years.
2019 -3.8%
2020 -2.2%
2021 +24.3%
2022 +7.8%
2023 -2.7%
As the following table shows, during the same period the connector industry achieved a five-year CAGR of +4.2%.
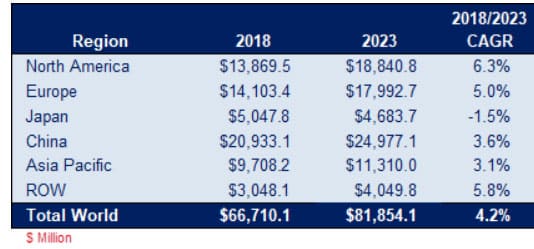
It is interesting to note North America and Europe achieved higher growth than China. As China matures and the West becomes concerned about dependence on China, this is a trend to watch.
The five-year CAGR of +4.2% is inflated because we report in U.S. dollars, meaning the industry was probably flat due to rising inflation during this period.
2024 Industry Forecast
We are forecasting world connector sales growth of 4.2%. North America and Europe will grow comparable to China and Asia Pacific.
The following table provides 2022 and 2023 actual performance and our 2024 forecast.
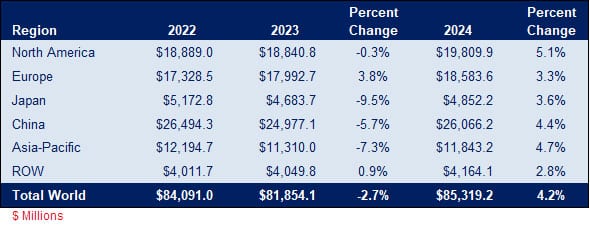
We base this forecast on the following:
- World economies are forecast to grow in the 2.5% to 3.5% range.
- Inflation will probably continue in the 3% range.
- World connector sales are up 2.8% through March, indicating demand for connectors appears to be improving.
Bishop & Associates, incorporated in 1985, is the leading research firm on the connector industry. The Bishop Report is a monthly newsletter that tracks the performance of the industry. To learn more or to subscribe, follow this link.