
The contact interface, D in Figure 1.3 is arguably the heart of a connector system. The structure and properties of the interface which is created as the plug and receptacle contact springs come together determines both the electrical and mechanical performance characteristics of a connector.
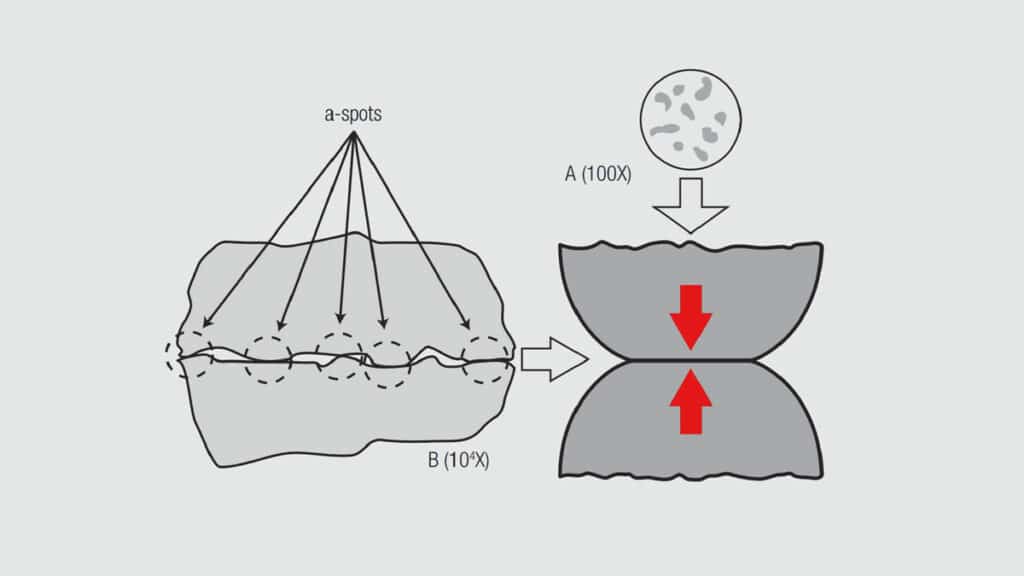
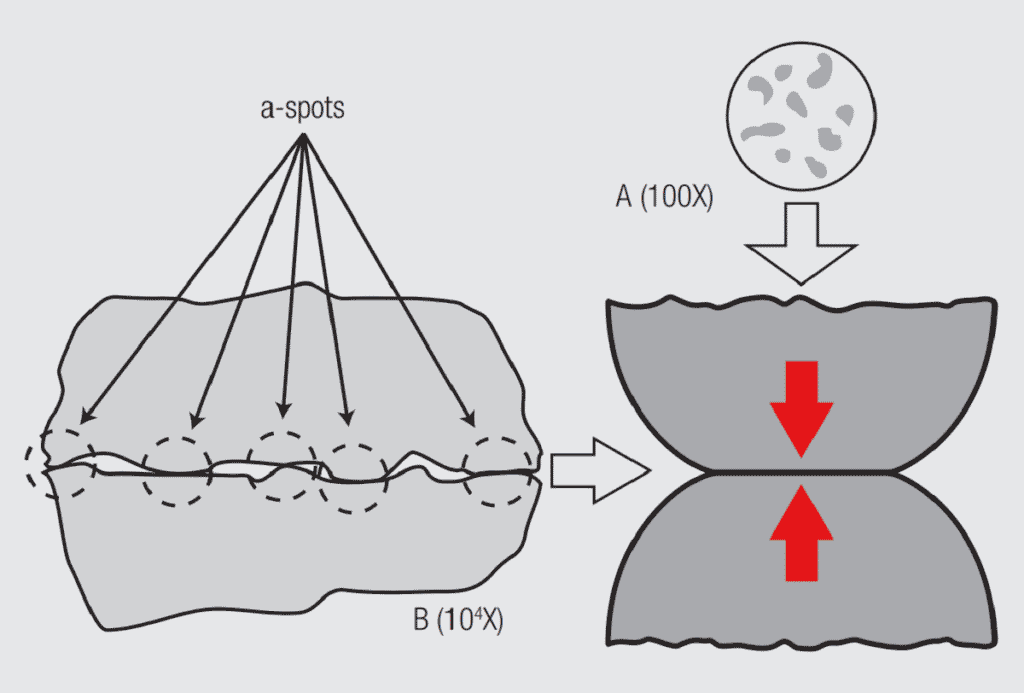
The most important characteristic of the contact interface is that it is created when two rough surfaces come into contact. While a cursory look at the surfaces of contact springs suggests that they are smooth, on the microscale of the contact interface these surfaces are quite rough. The individual high points on the surface are referred to as asperities. Figure 1.15 schematically illustrates the contact interface that would be created if two spheres were brought in contact under an applied load. As the two surfaces approach each other the asperities that happen to be in proximity to each other come together first. As these asperities deform against each other under the applied load, the surfaces continue to approach each other bringing additional asperities into contact. Thus, a contact interface consists of a number of individual asperity contact points, called a-spots. The number is determined by the roughness of the surface and the applied load which determines the total area of a-spot contact. These a-spots are distributed over an apparent contact area that is determined by the geometries of the post and receptacle contact springs as they come together.

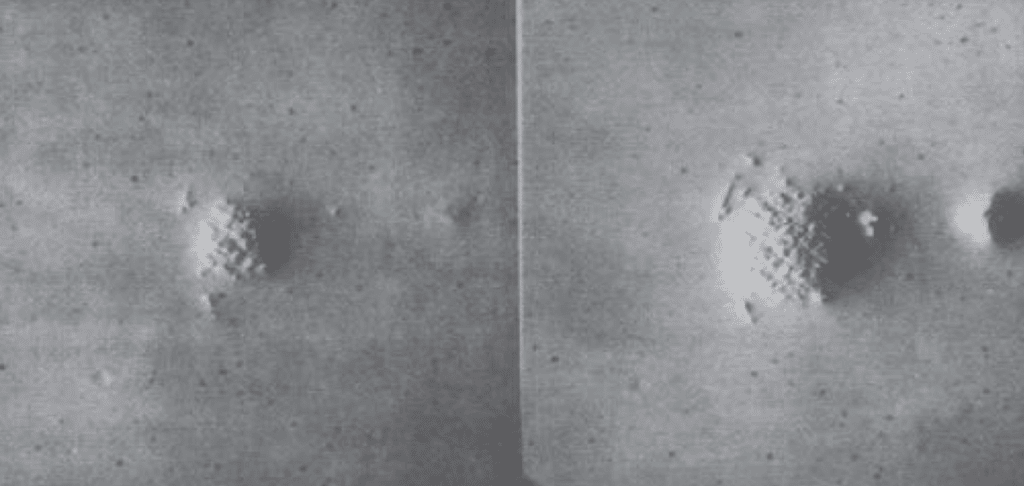
That this a-spot model is realistic is verified by consideration of Figure 1.16 which shows an actual contact interface between a stainless steel ball bearing and a glass plate. The ball bearing deforms slightly against the glass plate under the applied load and individual a-spots are created. Note the similarity to Figure 1.15. The photo on the right was taken after an increase in the applied load which brings the surfaces closer together. This, in turn, increases the contact area of existing a-spots as well as creating additional a-spots.

Returning to Figure 1.15, a side view of the contact interface, also shows a distribution of a-spots across the contact interface. This view will lead to an understanding of why the contact interface structure affects both the mechanical and electrical performance. Consider two mechanical effects. First, if a shear stress is applied to this a-spot contact interface the interface will remain stable until the stress is sufficient to break the a-spot interfaces. Second, when the interface does break a wear process comes into play. These two effects will be discussed in Chapter I/1.3.2 The Mechanical Interface: Friction and Wear/Durability.
Electrical performance is affected by the fact that any current flow from the upper sphere to the lower, would have to flow through the individual a-spots. This condition leads to an electrical resistance called constriction resistance which will be discussed in some detail in Chapter I/1.3.3 The Electrical Interface: Contact Resistance.