Vibration parameters are arguably the most problematic of the conditioning/exposure testing parameters. The most significant issue is that the vibration conditions in the field are unknown except for the recognition that they are application dependent and highly variable. Thus vibration testing is standardized to allow comparative rather than performance evaluations.
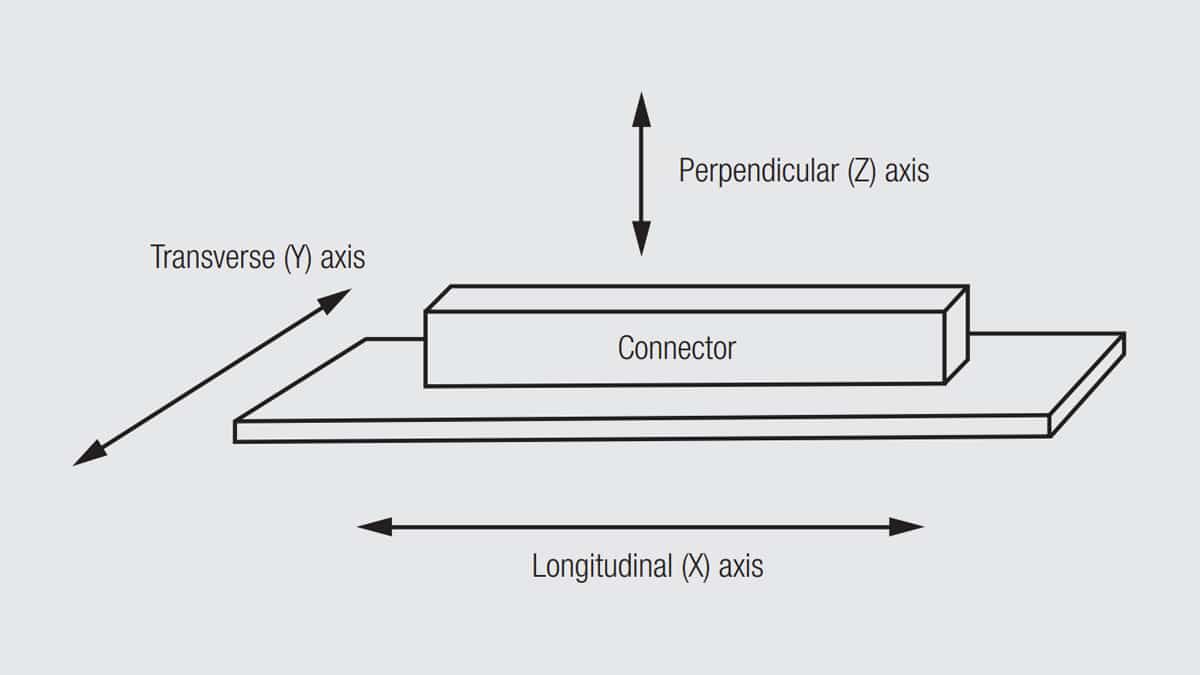
Vibration testing is performed in three axes as illustrated in Figure 2.118.

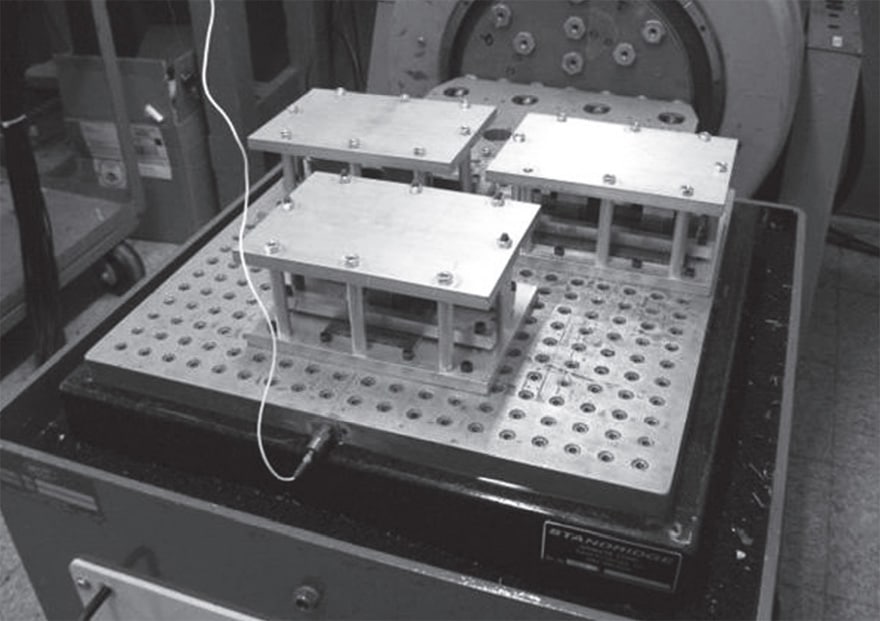
In the configuration shown in Figure 2.118, the Y and Z axes are the most significant. The Y axis is sensitive to rocking motions of the connector and, therefore, fretting motions and degradation, and the height of the connector can result in amplification of the rocking forces. The Z axis is the mating direction of the connector, and, therefore, is also susceptible to fretting degradation. Clearly how the connector is fixtured, and the orientation of the fixtured connection on the vibration table can have a significant influence on the connector performance in the test. A typical vibration table for fixturing of samples is shown in Figure 2.119.
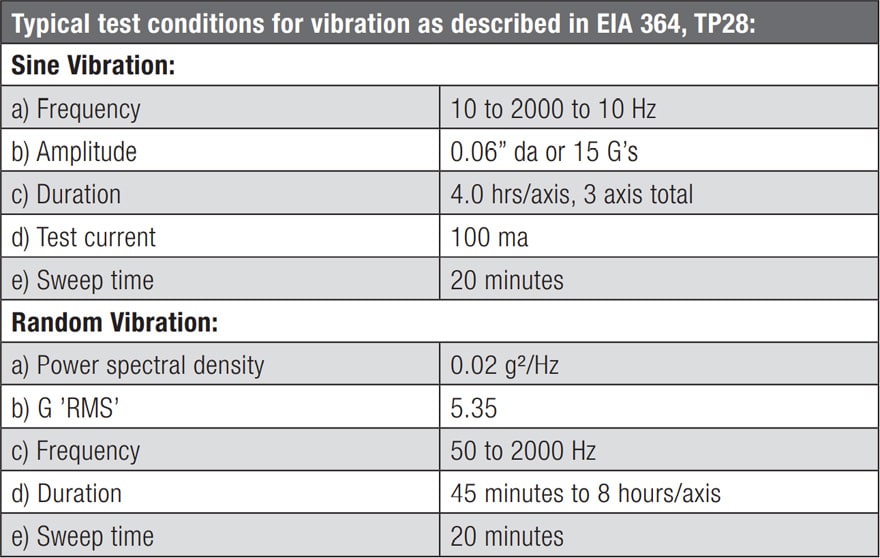
The two major vibration methodologies are sine and random vibration. Sine vibration sweeps through the selected frequency levels at a selected amplitude and for a selected duration. Random vibration, as the name implies, varies the frequencies and amplitudes of vibration within the selected frequency spectrum. While sine vibration is the most commonly specified method, the random vibration is more representative of field conditions. Table 2.8 shows typical vibration testing.
Definition of a vibration environment involves consideration of at least the following factors: severity levels (amplitude and frequency), duration (time or cycles per axis), attributes to be monitored (resistance, discontinuities) and fixturing. The fixturing decisions must take a systems approach to look for factors that could amplify the effects of vibrational forces on the connector. For example, in an edge card connector the length of the board above the connector can have a significant effect on the vibrational impact on the Y axis.
LLCR is a commonly used measurement for vibration testing. It is used primarily for assessment of fretting degradation and can be done continuously or periodically depending on the data desired. Sophisticated data gathering techniques may be required for this purpose.
In addition to assessment of mechanical stability, vibration is also used to determine whether electrical discontinuities may occur during vibration. There are two levels of discontinuity monitoring. One microsecond discontinuity monitoring has been the most commonly used approach. Recently shorter discontinuities have become of interest and discontinuities in the range from 50 nanoseconds to 2 nanoseconds have been monitored with increasingly sophisticated measurement and fixturing requirements. Discussion of these methods are outside the scope of this chapter.